
Finding Podcast - HK listeners edition
Finding Podcast - HK listeners edition
What podcast do Hong Kong listeners listens to?

While Podcast was a big thing in the US (Could be $100M big for the most popular show!), the podcast scene is just getting started in Hong Kong. In the recent months, I have discovered more and more interesting Cantonese podcast started to emerge, contributing to the deserted podcast scene here in Hong Kong. But as a data geek, I naturally start to wonder:
What podcast do Hong Kong listeners follow?
Sounds like an interesting mini project, lets dig in!

I am going to go through the steps that I went through below in the order of :
Finding data
Scraping data
Storing data
Automate the job
Aggregate data
Visualizing data
Finding the data
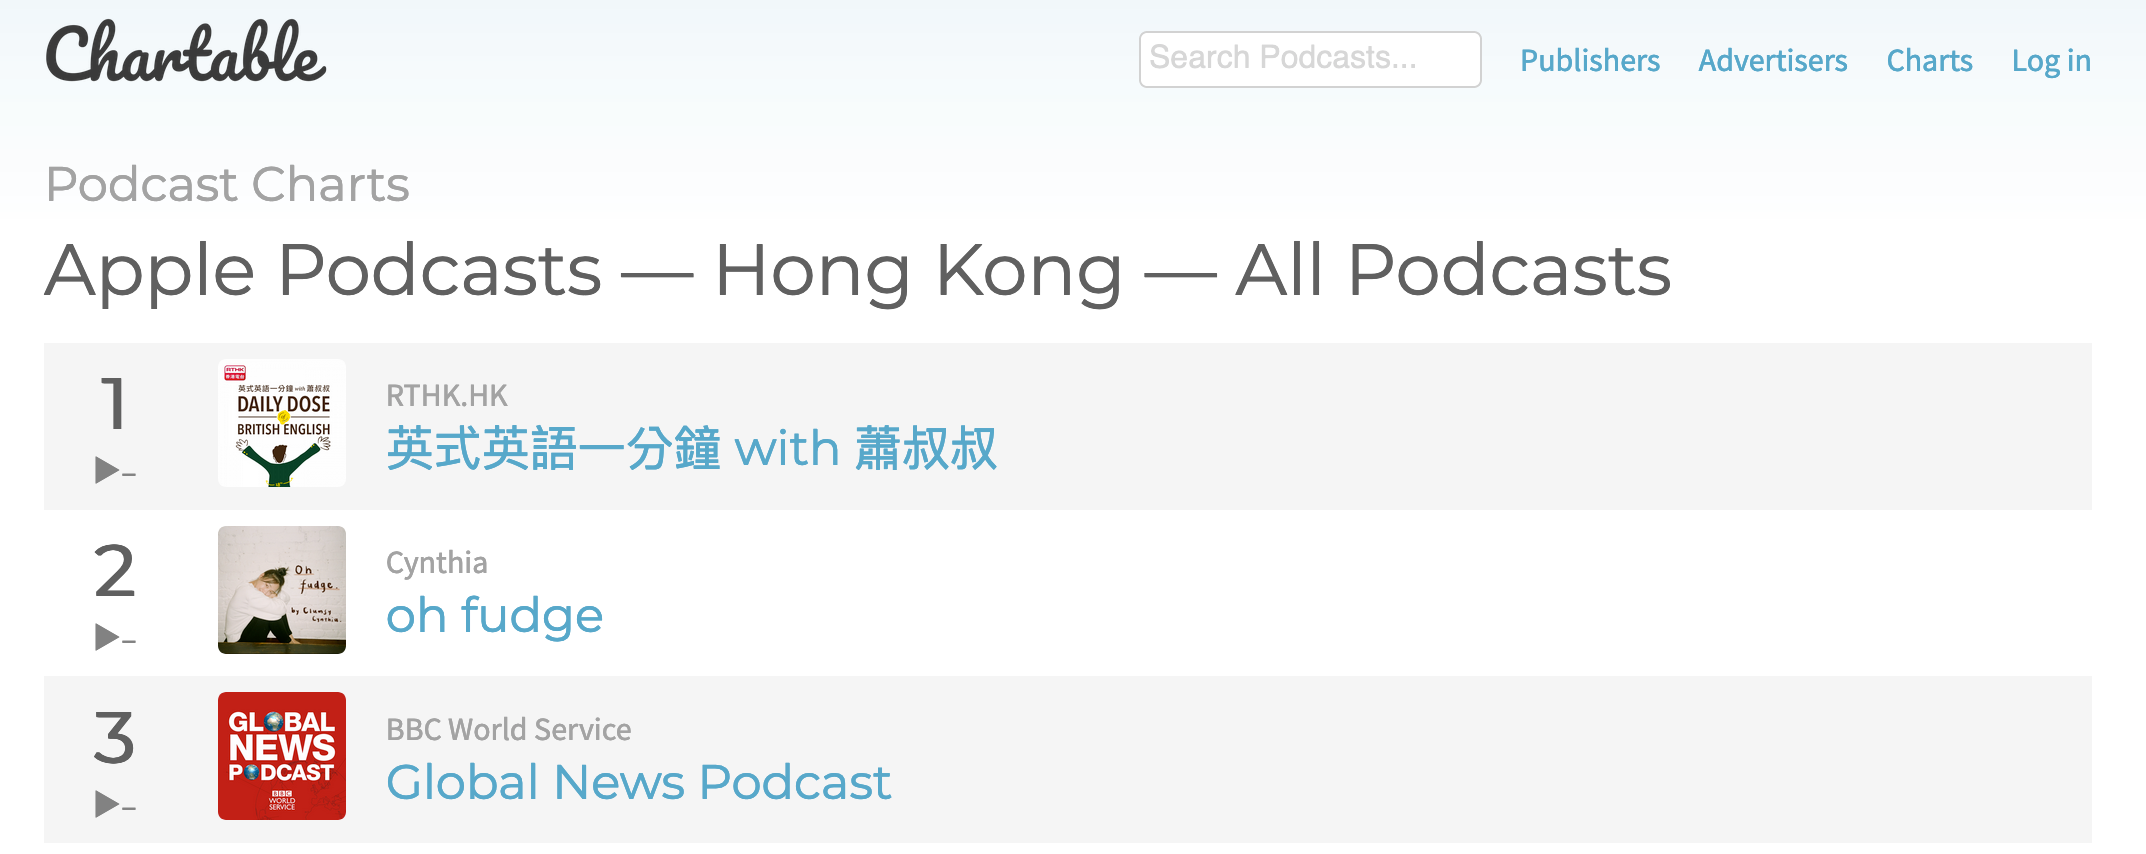
I went online and search for some podcast ranking websites and I eventually found one called Chartable. Turns out this website has detailed rankings of podcast in not just many region, but also a wide variety of genres of podcasts. In this article, I would be focusing on the iTunes charts only as a start.
The only problem is the website would only show you the ranking of the same day that you visit the website. We would need to do a bit more in order to track the rankings everyday. I will get to that later on, but that’s a start!
Scraping data
Now that we found the website that contains the data, lets start getting it into our computer. I used a combination of the requests library and the built-in read_html method in pandas to do the trick. Another way is of course use libraries like BeautifulSoup to find the table within the html page. Fortunately the html of this website is very clearly structured, the read_html method will do just fine here for now.

Storing data
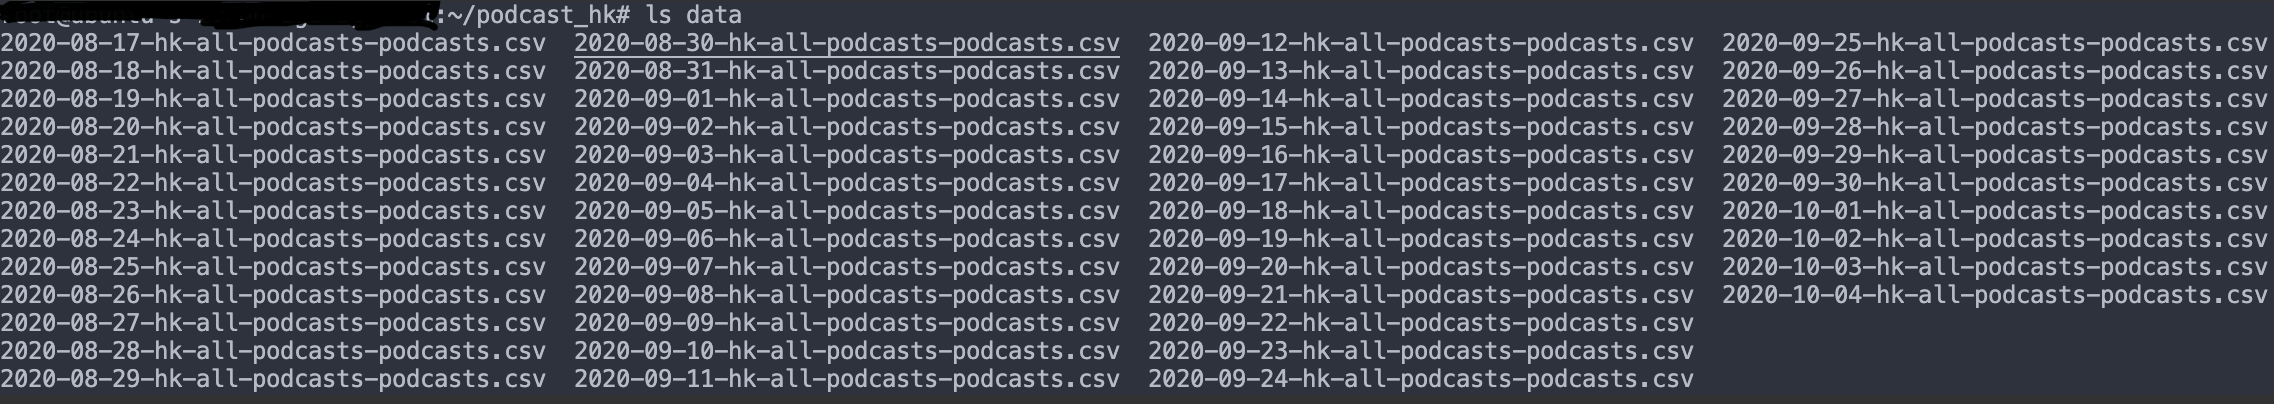
While there are many ways to save the data, since this is a really tiny piece of data, I just went with saving csv locally at a directory. But of course, saving it into other formats like SQLite will do as well at this volume of data. Another way is to clean the data upstream and save it in some more machine friendly formats like JSON before saving it into any disk space.
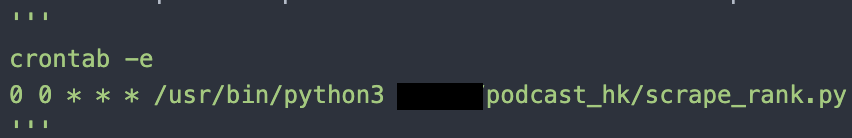
Automate it
Now that we get the data, but as above mentioned, the website only shows you the ranking of the day that you visit the website. What do we do if we want to download it everyday? Cronjob is here to rescue. I used a 5 USD droplet from DigitalOcean to host the scraping script. After that, I have setup a cronjob on the machine so that it would be instructed to run the script everyday with the given cron schedule. This simple setup worked so well that by the time I come back to the data, a month has already passed and now I have over a month of podcast ranks data now.
Aggregate data
Now that we finally have some sort of volume of data, we can start look into it. Aggregating the data for a little more than a months turns out to be a little bit tricky then I thought. In particular the representation of rankings and rank changes are in arrows signs instead of number/ integer (Talking about '▲' vs '+'). I had to do some lambda magic to transform the data into a more friendly csv file. Another trouble is the way that I save csv daily means I would have to concatenate those rankings everyday into a overall view so that some analysis can be performed here.
Show me the ranks!
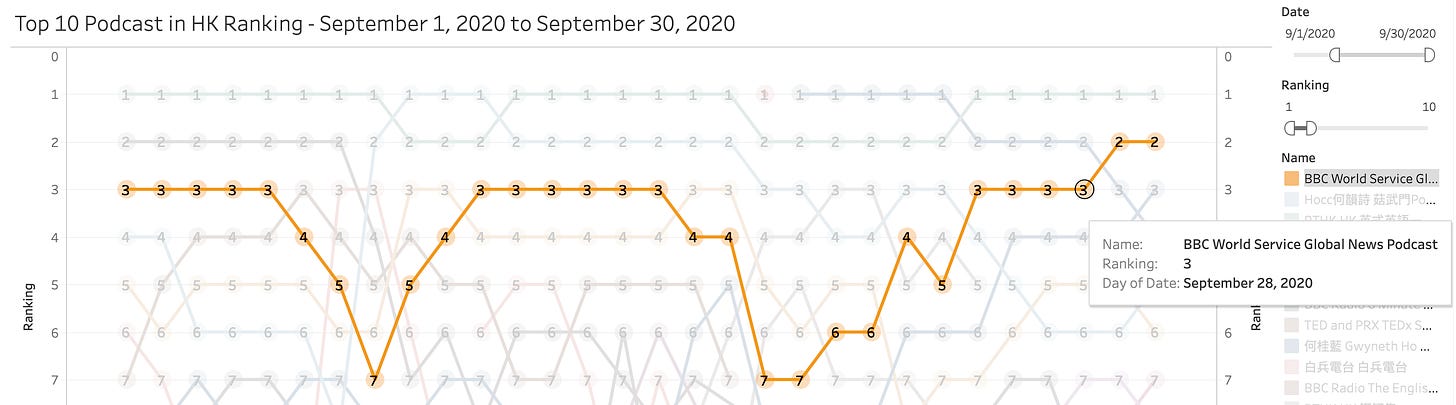
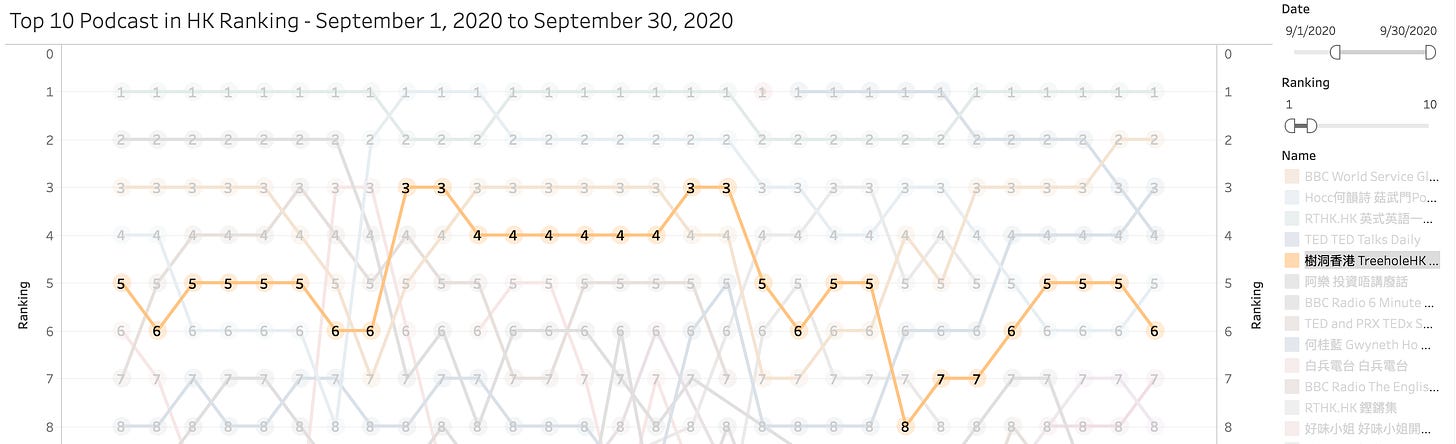
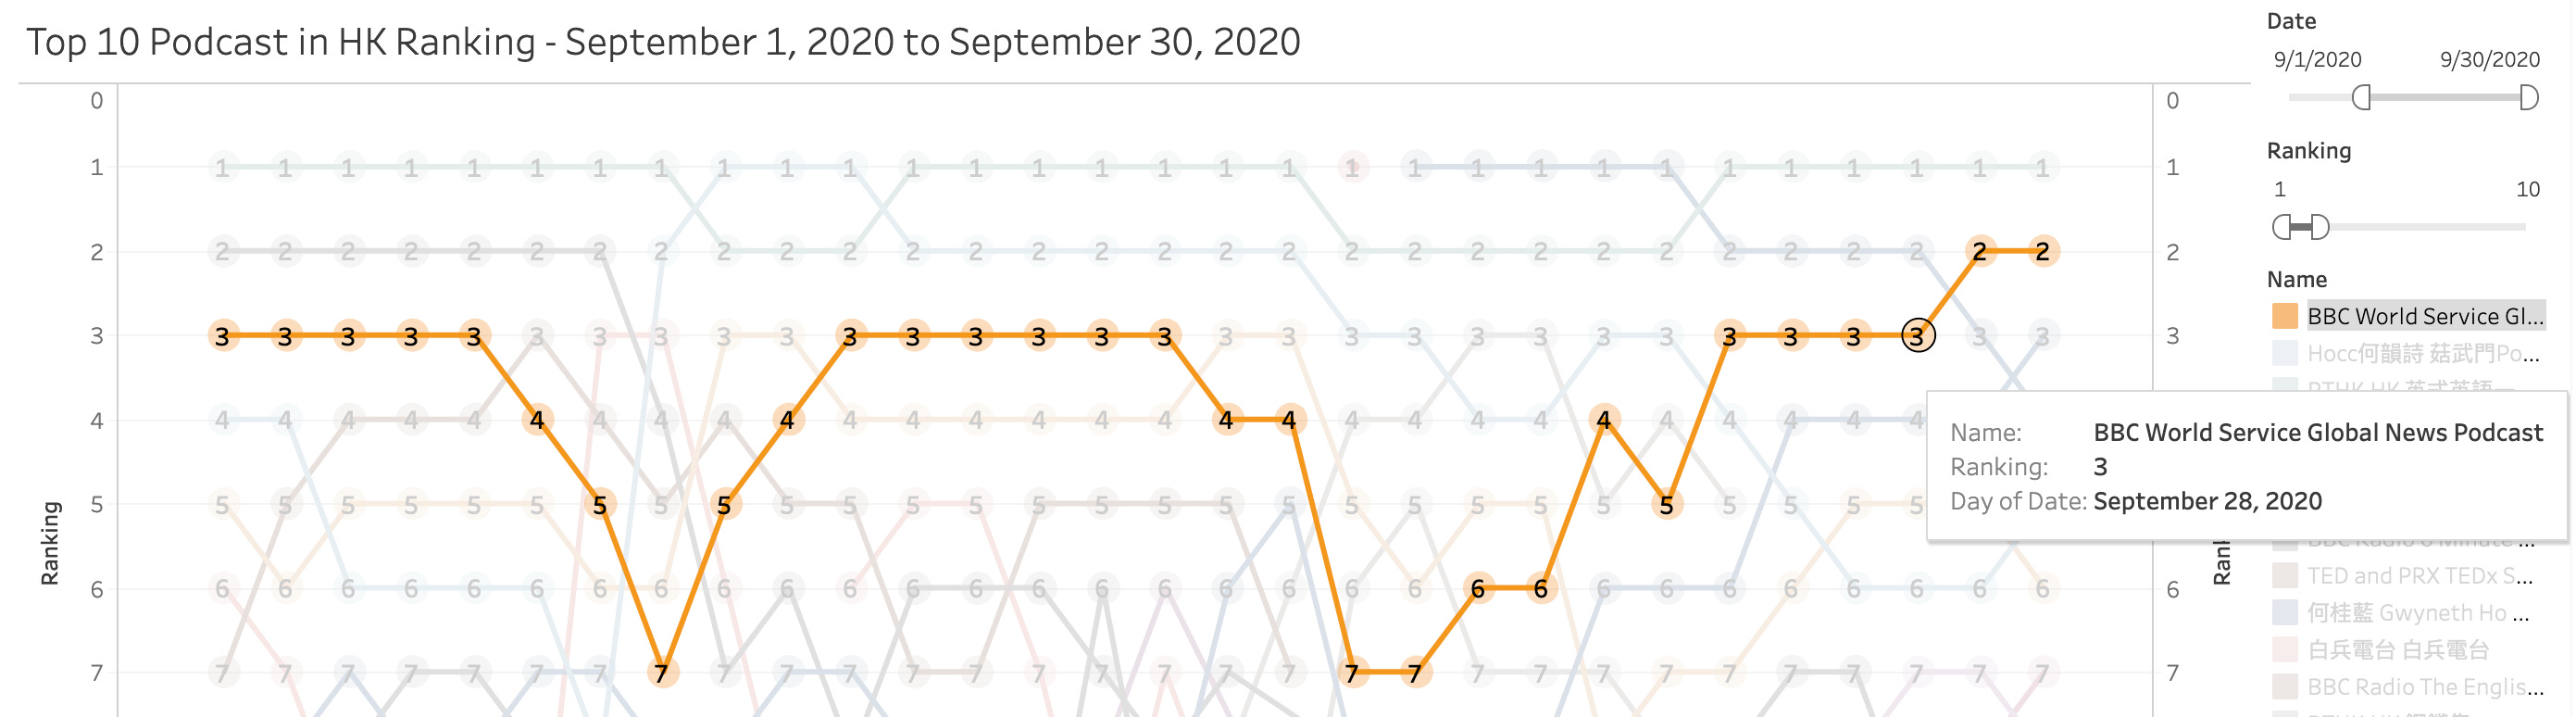
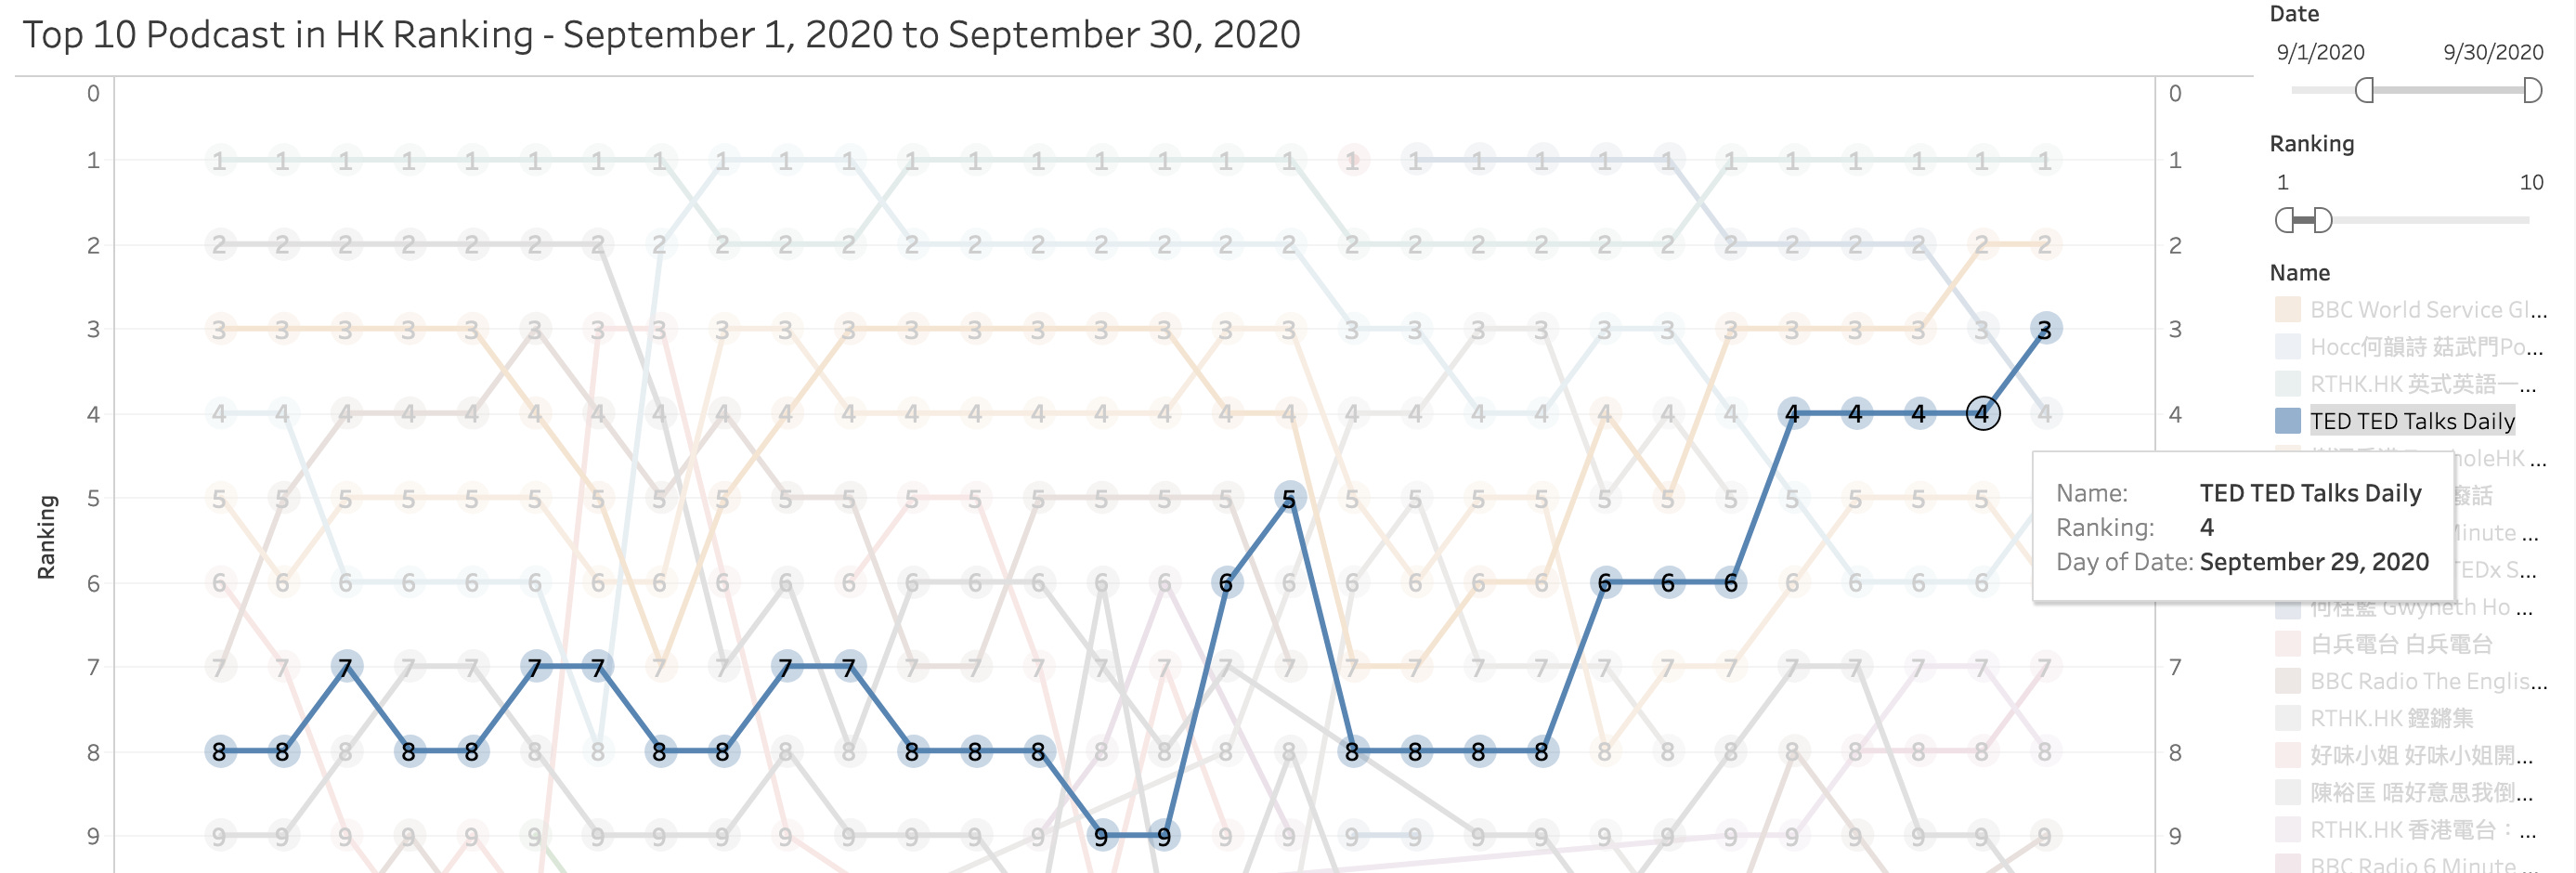
Last but not least, lets start to dig into the rankings! After a quick look at the data, I decided to use Tableau to quickly plot out the top 10 podcast ranking for September and here is a quick look:
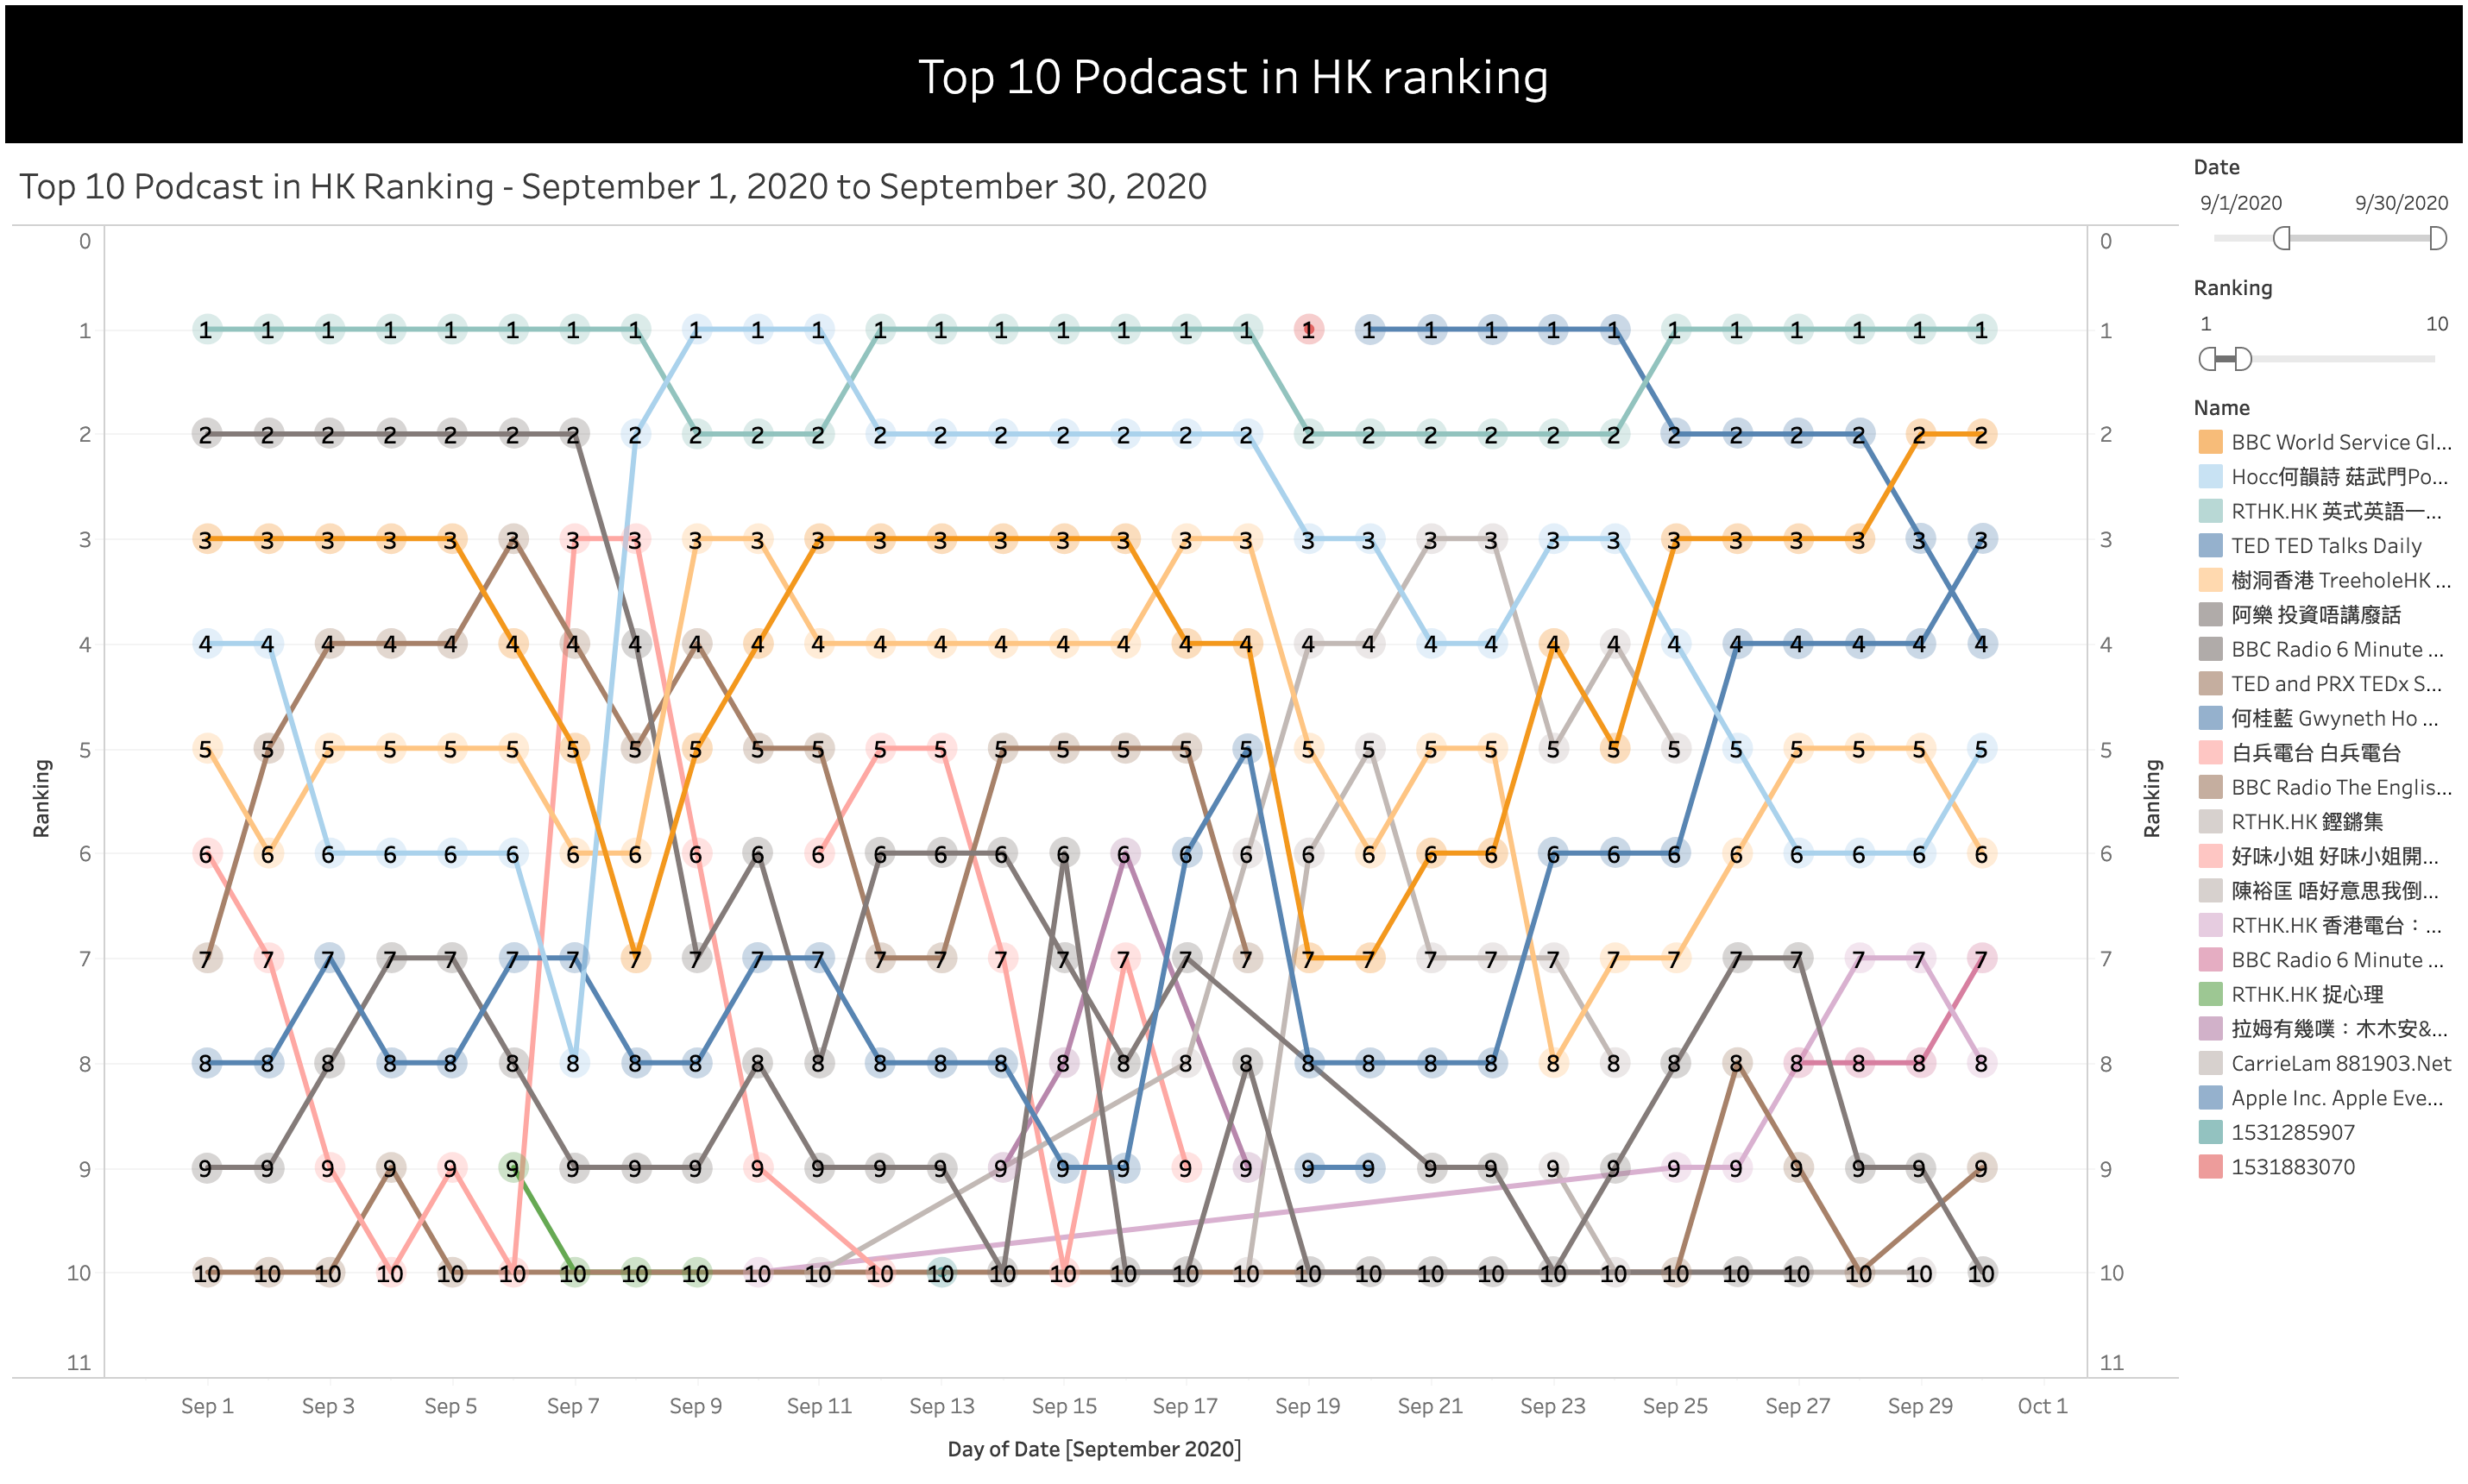
With some eyeballing into this chart and using some filters we can find:
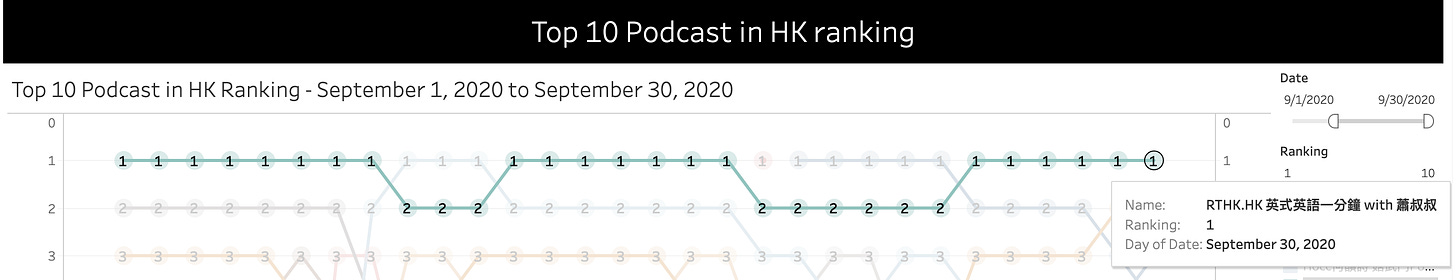
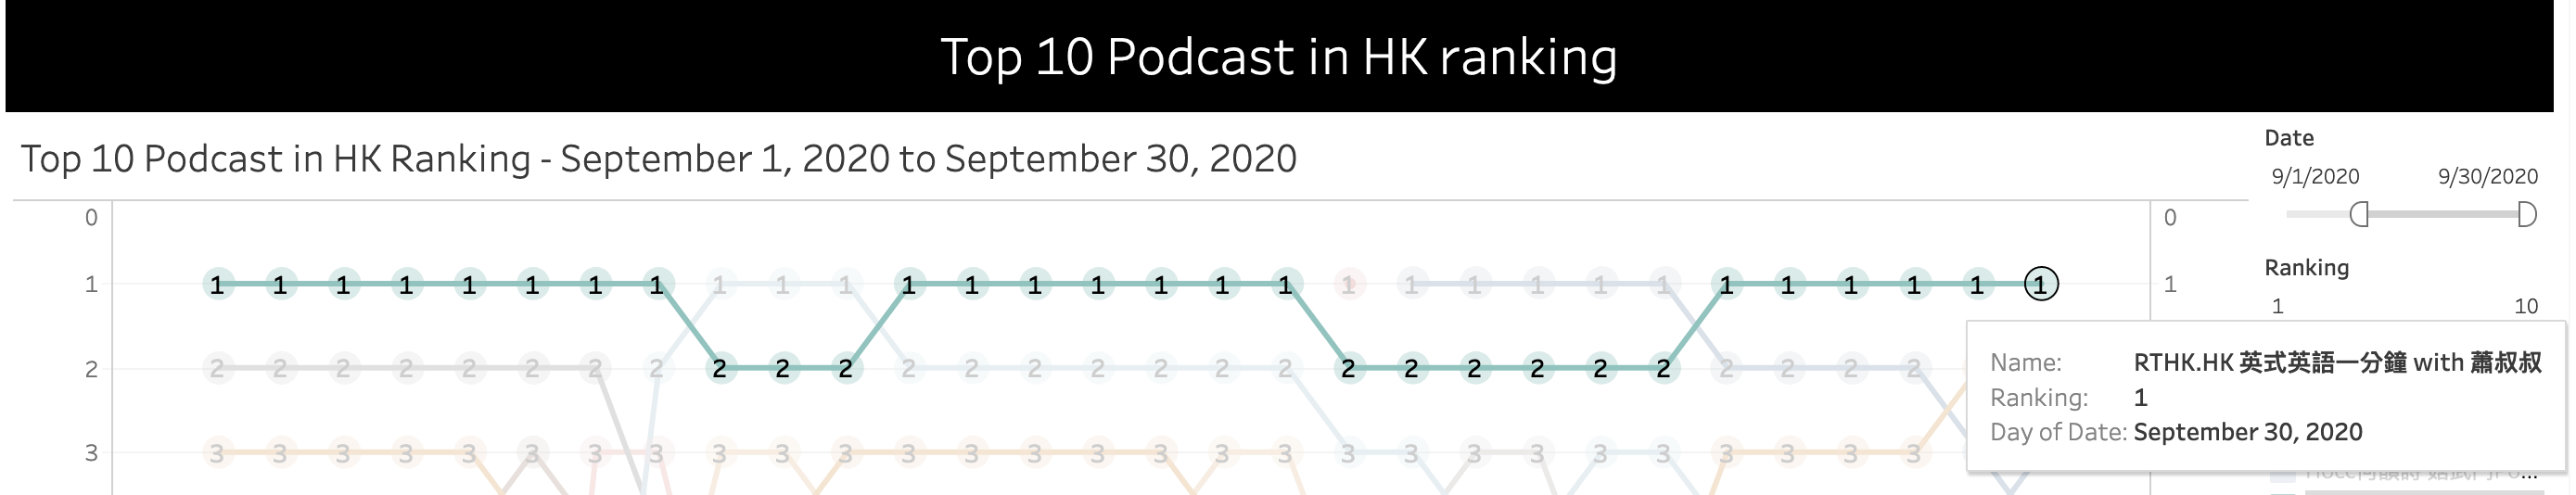
The One Minute English podcast with Uncle Siu from RTHK was the most popular podcast throughout the month, either the first or the second in rank!
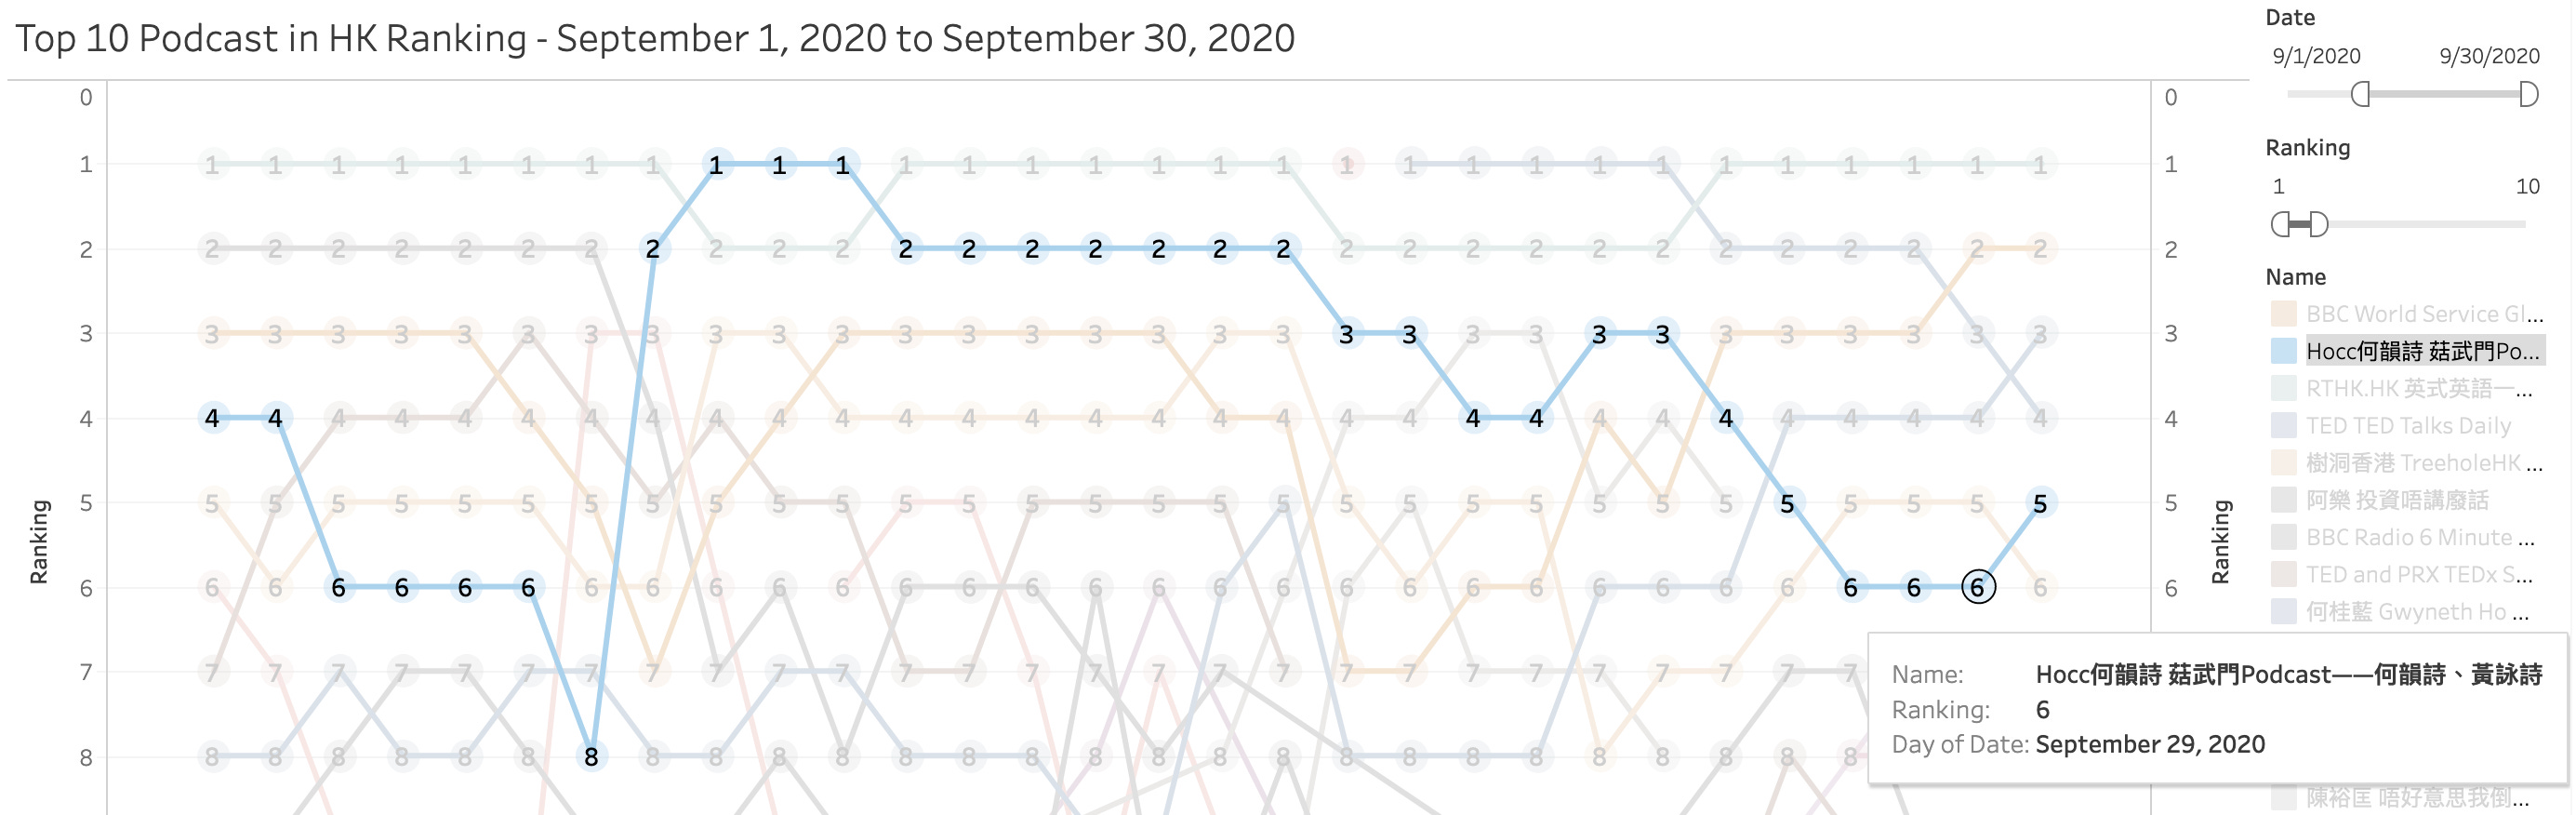
Another popular one is a podcast hosted by independent singer Denise Ho
Global News Podcast by BBC World Service are also a popular one, but ranks are flucuting also
A rising star in this ranking turns out to be TED Talks Daily, guess we could all use some inspirations from it

Treehole Hong Kong, which is a Cantonese Podcast that introduces bite-sized psychology concepts that are cleverly applied to our daily life
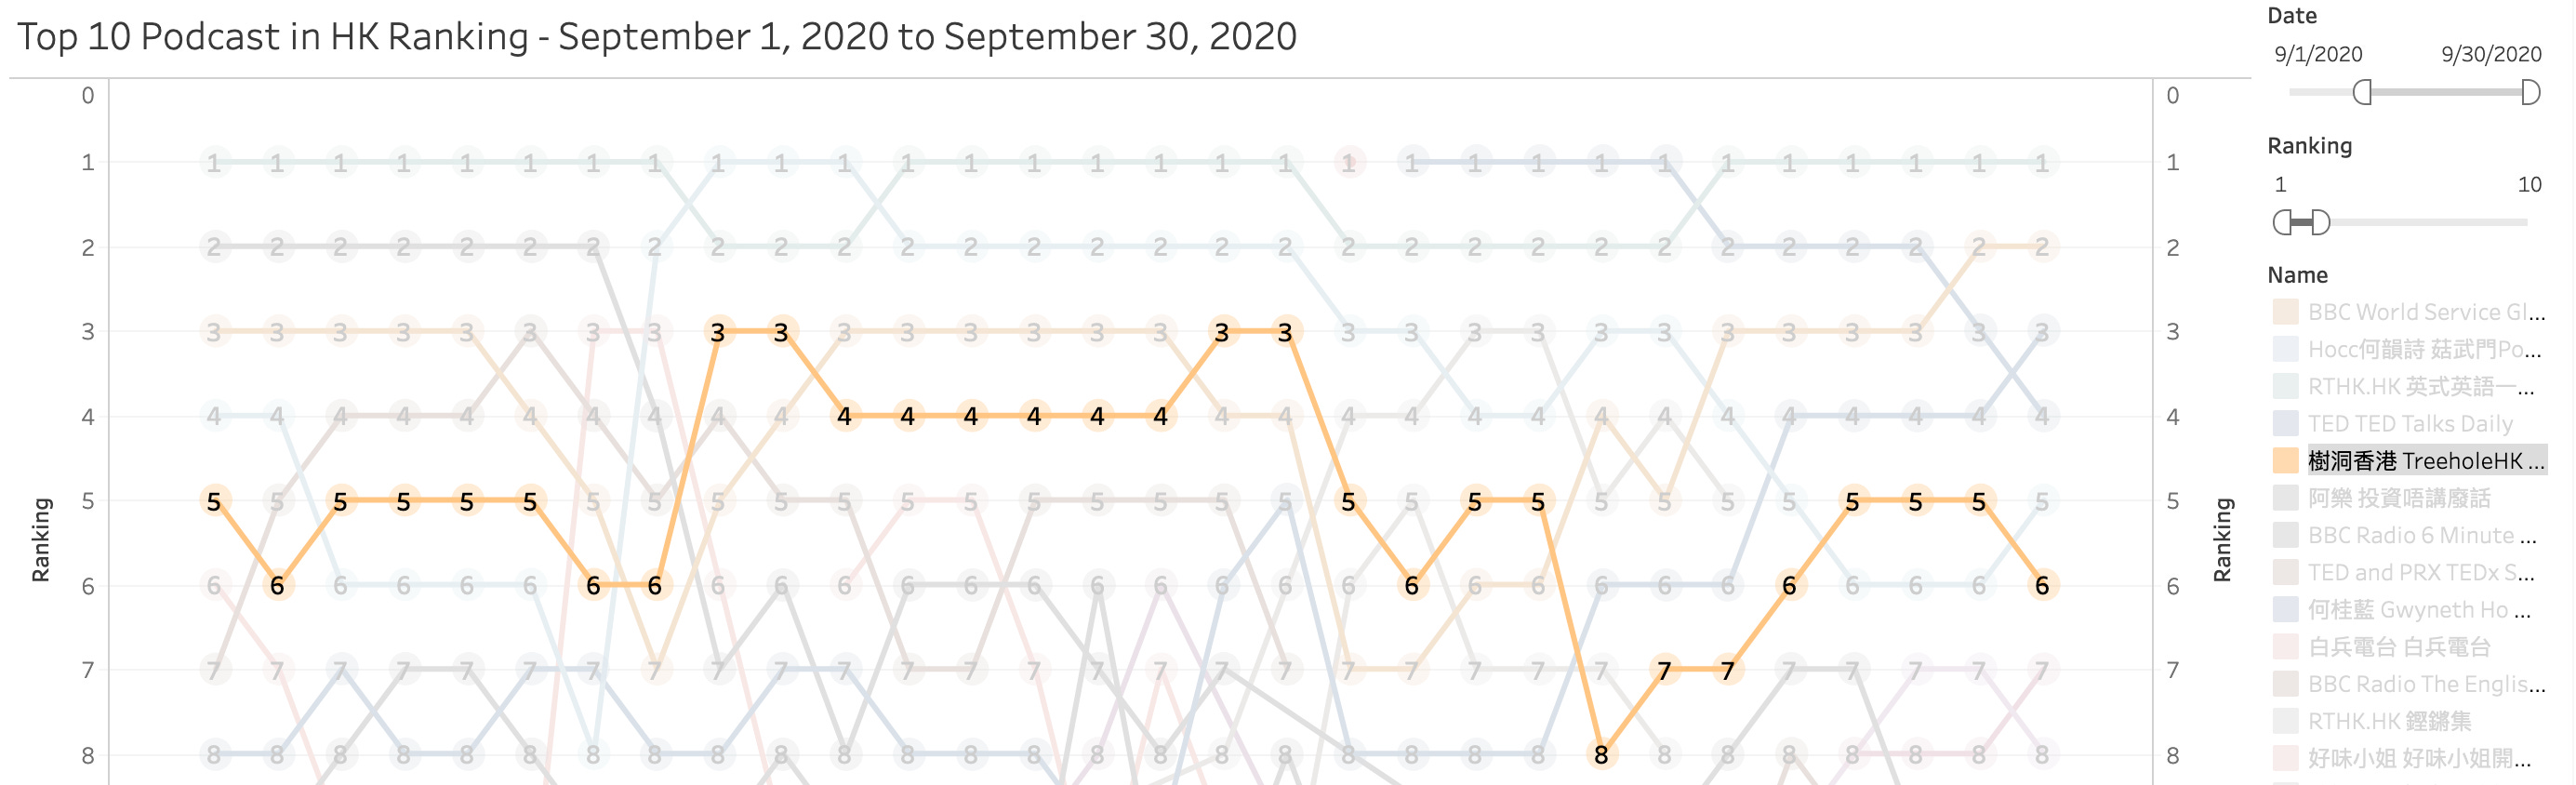
Interestingly, out of the 5 podcast I mentioned above, 3 of them are actually in English instead of Cantonese. This mixture of east and west of Hong Kong is still around in this podcast ranking table.
Future developments
There are more to find out obviously, such as comparing the ranking between iTunes and Spotify, as well as to find out if there are really some trending podcast in the lower parts of the ranks by looking at the net rank movement for each podcast, etc.
And that’s all so far for this mini project, see if there are more interesting things that are to be unveiled as time goes by. Leave some comments or thought around if you have any, stay tuned for some upcoming updates!
Bonus
P.S Check out this back of the envelop script for scraping the ranks!
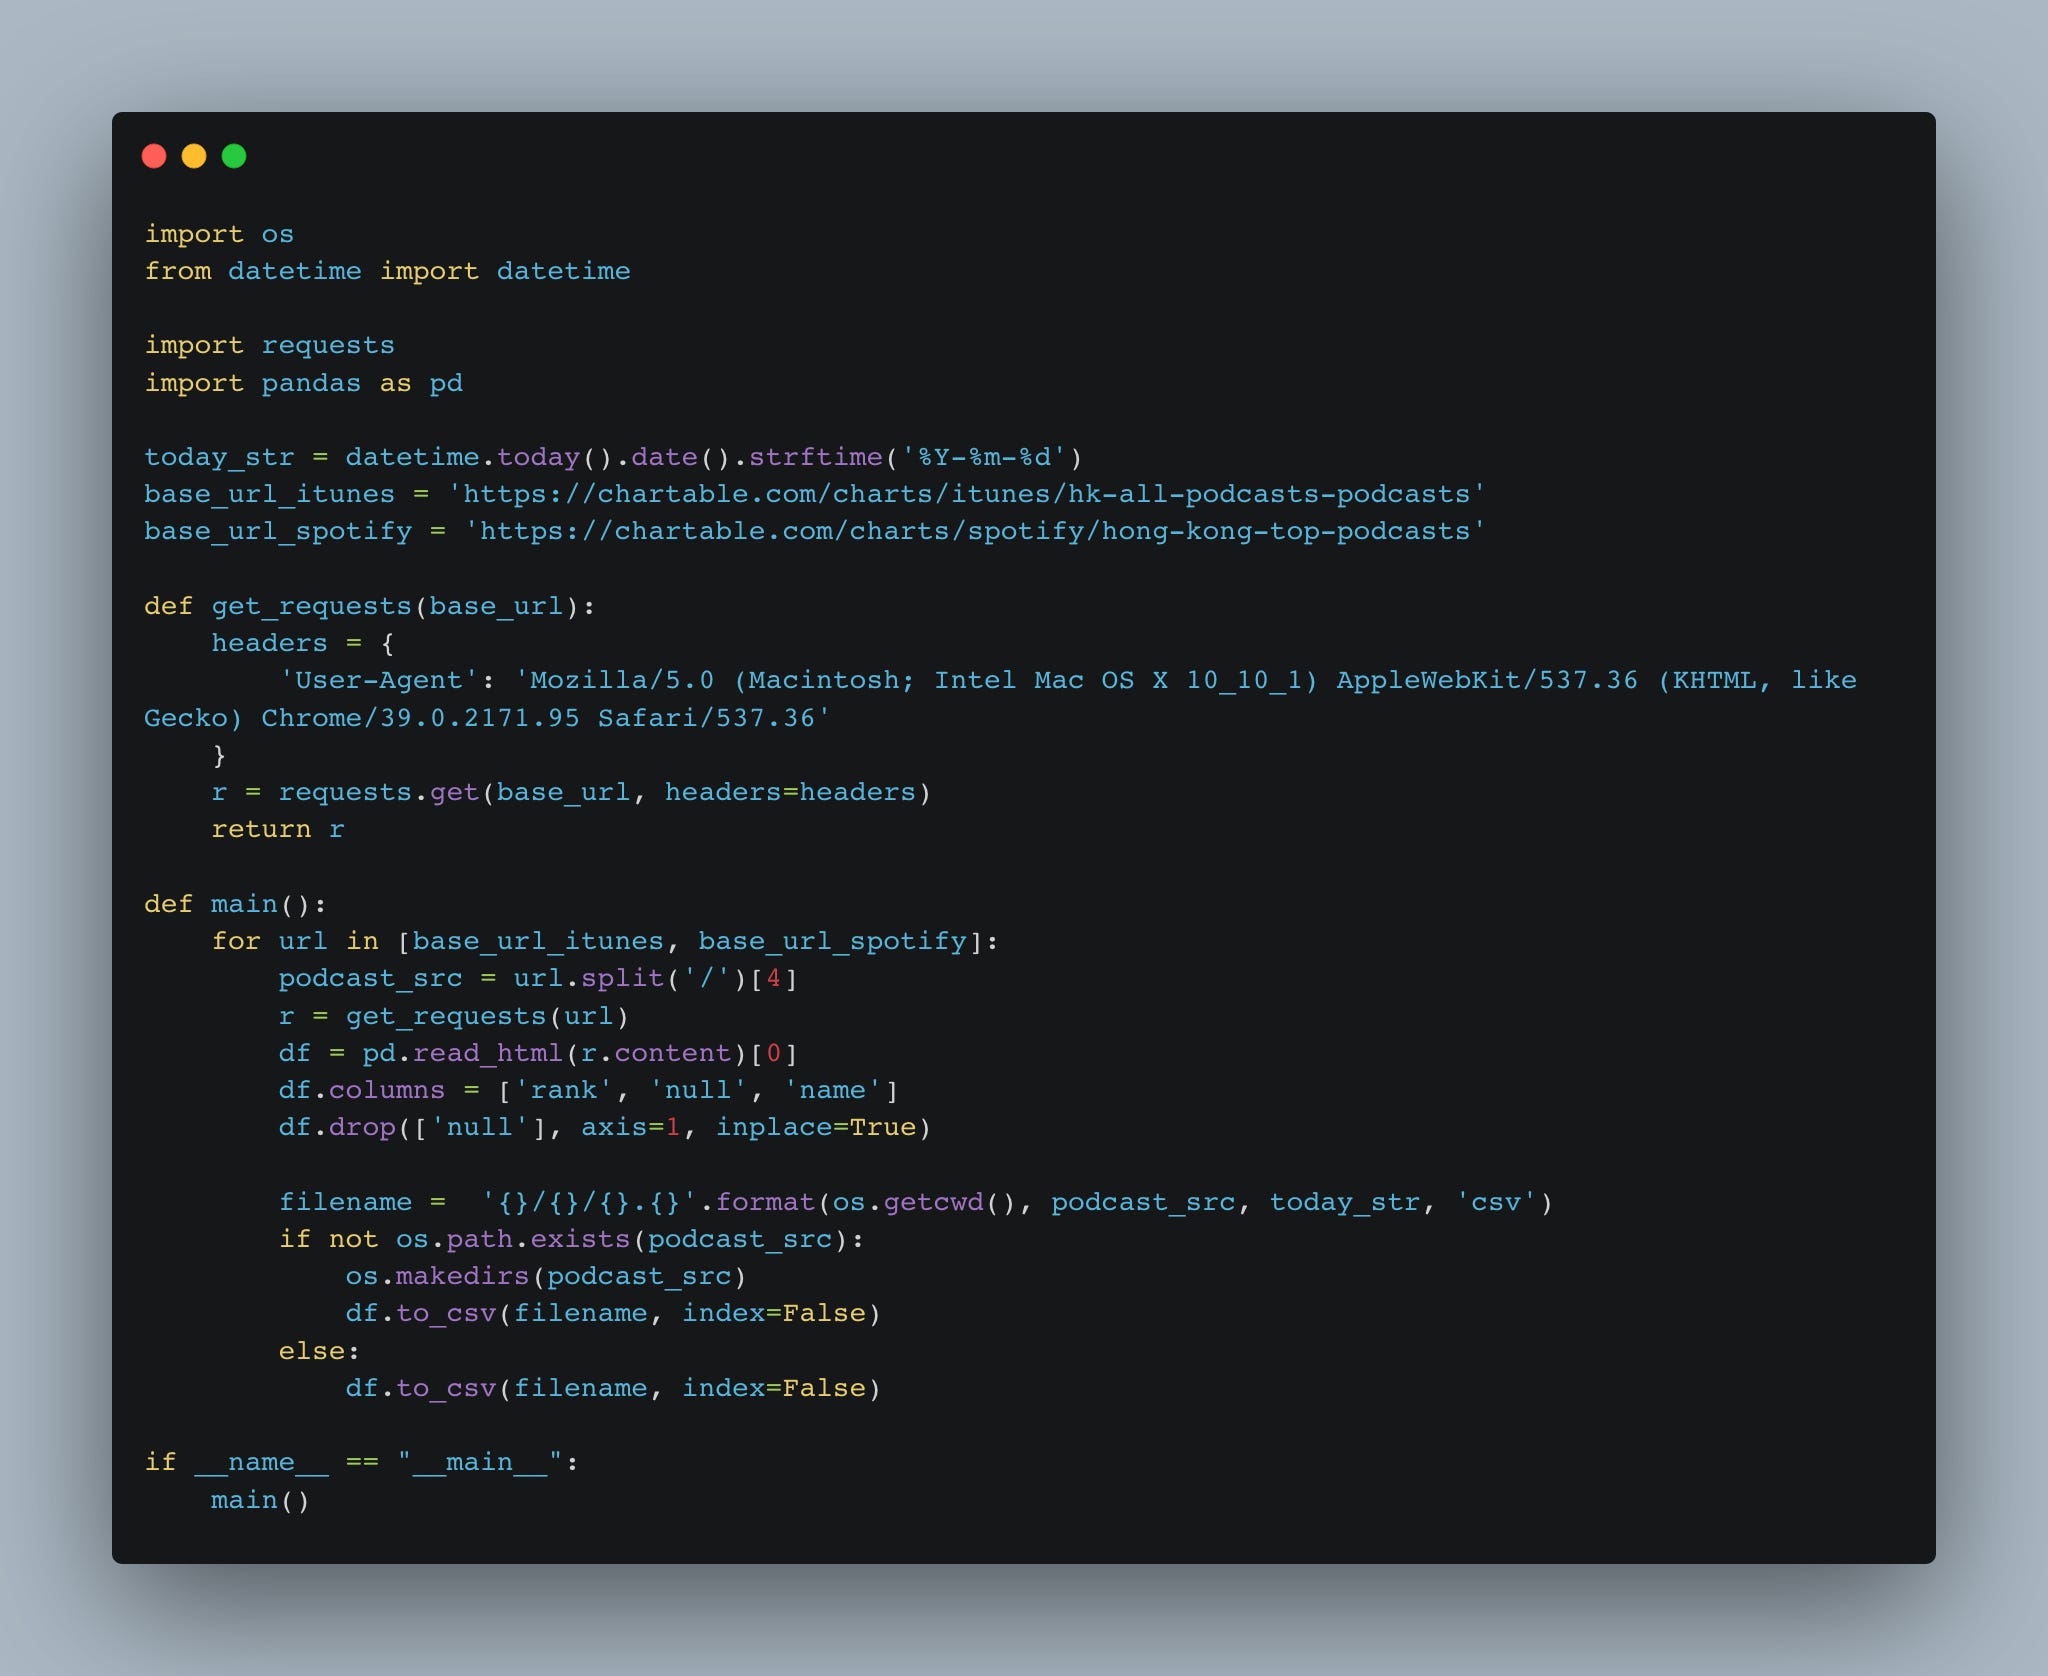
import os
from datetime import datetime

import requests
import pandas as pd

today_str = datetime.today().date().strftime('%Y-%m-%d')
base_url_itunes = 'https://chartable.com/charts/itunes/hk-all-podcasts-podcasts'
base_url_spotify = 'https://chartable.com/charts/spotify/hong-kong-top-podcasts'

def get_requests(base_url):
    headers = {
        'User-Agent': 'Mozilla/5.0 (Macintosh; Intel Mac OS X 10_10_1) AppleWebKit/537.36 (KHTML, like Gecko) Chrome/39.0.2171.95 Safari/537.36'
    }
    r = requests.get(base_url, headers=headers)
    return r

def main():
    for url in [base_url_itunes, base_url_spotify]:
        podcast_src = url.split('/')[4]
        r = get_requests(url)
        df = pd.read_html(r.content)[0]
        df.columns = ['rank', 'null', 'name']
        df.drop(['null'], axis=1, inplace=True)

        filename =  '{}/{}/{}.{}'.format(os.getcwd(), podcast_src, today_str, 'csv')
        if not os.path.exists(podcast_src):
            os.makedirs(podcast_src)
            df.to_csv(filename, index=False)
        else:
            df.to_csv(filename, index=False)

if __name__ == "__main__":
    main()